
Preliminaries
Create a cover sheet for your assignment to include the following information;
• Assignment Number
• Name
• Due date (refer to the separate document Introduction and Assignment Schedule)
• Date submitted
• Number of hours spent on studying for and completing the assignment.
• What you learnt from the assignment
• Issues that you remain uncertain of
Note that the last three items (hours, what you learnt and what you are uncertain about) are an essential part of the assignment. The last two force you to reflect for a moment and think- what was this really all about?
Task 1 – Relevant to Chapter 7 Weighting 13%
Chapter 7 is probably the most complex chapter and contains considerable theoretical development of plate theory. It is considered that an understanding of this chapter is essential to any engineers who use Strand7 (or another analysis package such as Ram Concept that supports the use of plate elements) to assist in the analysis and design of reinforced concrete structures. It explores a number of issues and identifies some significant errors that may occur if you apply plate element analysis without some background understanding.
Deliverables: Q1
a) Set up models of the three slabs systems shown in figure 7.1 carrying only a 10 kPa superimposed UDL (do not turn on gravity to avoid inclusion of self-weight). Use a slab thickness of 200 mm. Each slab has the same span of 6000 mm between pinned supports, and is 4500 mm wide. The slabs are different only in that the second and third slabs involve 1200 mm wide band beams of depth 500 mm and 1000 mm respectively. Use your own initiative concerning element type and the level of subdivision. Reproduce figure 7.1 and graphs 7.2 and 7.3 and comment on your results in comparison to the text. Reproduce graphs 7.4 and 7.5 for your understanding, no need to submit these 2 graphs for marking. (60 marks)
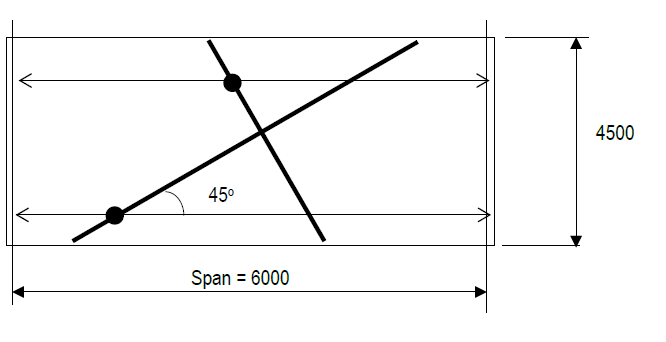
b) The 200 thick simply supported slab shown below spans 6000 mm and carries a total w* of 20 kPa. The slab is to be reinforced with an orthogonal reinforcement grid at 45o and 90o to the spanning direction. Determine the reinforcement requirements in these directions and compare to the ‘normal’ situation where reo is parallel and perpendicular to the span. (Assume 20 mm cover). Note that the “answer” to this question is contained in the text pages 147 to 178. I do not intend that you should laboriously ‘study’ all these pages. This question is designed to require you to scan through these pages sufficient to identify the nature of the problem and the particular answer to this question.
Task 2 – Relevant to Chapter 8 Weighting 7%
I think you will find it hard not to get excited about chapter 8 that demonstrates with simple examples the extraordinary ability of Strand7 to model a wide variety of dynamic phenomena. Importantly, even if you do not use Strand7 for analysis it is considered that this chapter will give you a better appreciation of how an understanding of dynamics initially at a relatively qualitative level, is important in many areas of design.
Deliverables: Q2
Consider a bridge beam 1200 mm wide and 900 mm deep and has a span of 15 m, made of 32 MPa reinforced concrete. Refer Sec 8.9.
a) Calculate the natural frequencies and display the mode shapes of this beam. Subdivide the beam into 10 elements. (10 marks)
b) If a 120 kN axle load is moving at 100 kph, display the various load cases and the maximum static midspan displacement. Show the necessary calculations. (40 marks)
c) Reproduce graph 8.6 and comment with reference to dynamic amplification. (10 marks)
d) Reproduce graph 8.7 with a damping factor of 0.4 and comment. What would happen if the damping factor is 1
Task 3 Weighting 20%
This task is less prescriptive than the previous ones. It requires that you apply the skills that you have learnt to date to use FEA to investigate topics that have not been specifically covered in the text. It is expected that you will need to develop new skills and conceptual understanding in order to complete this assignment. This may require reference to the Strand7 Help files, appropriate texts and discussion with your peers. Contribution to the Discussion group to discuss problems and solutions will generally be regarded as a necessary part of this assignment. It is expected that to effectively investigate and document the task you choose to undertake that there should be evidence of at least 20 hours work.
Preliminary discussion – Using material nonlinear analysis
In previous assignments you have made extensive use of one form of “nonlinear analysis” where the objective has been to investigate the effects of “buckling”. Such nonlinear analysis is different to linear analysis in that equilibrium is assessed relative to the deformed position or geometry of the structure. (Refer to chapter 4.2 to remind yourself of the simplicity of this statement.) Such nonlinear analysis can be referred to as “geometry nonlinear”. Importantly this form of analysis still assumes linear material behaviour.
For this task you are required to investigate the use of another form of nonlinear analysis that may be called “material nonlinear analysis” where generally a “bi – linear” stress strain relationship will be defined with the stress increasing linearly up to the yield stress and then staying constant beyond the yield stress. In this form of analysis Strand firstly undertakes a linear analysis assuming that yield does not occur – it then looks at the results and in those regions where it predicts that yield has occurred, it effectively reduces the modulus of elasticity and then repeats the analysis until convergence is achieved. Like geometry nonlinear analysis, material nonlinear analysis is iterative and may or may not converge. It is possible to undertake “geometry and material nonlinear analysis” where the two nonlinear effects are simultaneously accounted for. For such analyses that have to take account of both buckling and yield it is often difficult to achieve convergence. For this reason it is normal to focus at least initially on just one of the two nonlinear effects.
To implement a material nonlinear analysis you firstly have to define a nonlinear stress strain relationship using Top menu item / Tables / Stress vs Strain. Then when you define a particular Plate or Beam Property, select the material (say steel) but also assign the nonlinear stress strain table to this material. This will override the (linear) modulus of elasticity and use instead the nonlinear relationship. To assist you in working out how to use this you may refer to Help items under “Material Non Linear” and “Tables”. Do not tell me anything about buckling or geometric second order effects. The focus of this assignment is only on material nonlinear analysis. The final step in implementing a material nonlinear analysis is that when you call up the Solver / Nonlinear you should make sure to check the Non Linear material button. You should generally uncheck the nonlinear geometry button to avoid the convergence problems referred to earlier. As with geometry nonlinear analysis you will need to set up a suitable set of load increments.
If you have not used material nonlinear analysis before then you are likely to learn much from the process. In first year engineering we developed formulae like σ = My/I and δ= 5/384 wL4/EI or Neuler = π2EI/L2. But such formulae never tell the full story. When we say σ = My/I we really mean – provided that our material behaves in a linear fashion and the material failure stress is not exceeded and the buckling failure stress is not exceeded, then – σ = My/I.
When we perform a material and geometry nonlinear analysis we do, at least potentially, get “almost” the full story. While the stress stays well below the yield stress and below any buckling stresses then first year engineering theory applies and both σ and δ increase linearly with the load. As the load increases and once yield develops things get a lot more complicated – but if we trust the software we are using and the model we have developed – then we are able to track the “real” behaviour of our structure well past initial yield of the material. When dealing with steel we still do not predict the point when “the beam busts” – because – in a way it never does. It does certainly become unserviceable and unacceptable but you can take a steel beam and tie it in a knot without it actually “breaking” – provide the steel is “ductile” – and most steels used for structural purposes are. The strain corresponding to a stress of 300 MPa in a steel member is 0.15%. The strain to cause fracture in a ductile steel is generally in excess of 100 times this or 15%.
The form of material nonlinear analysis implemented by Strand7 does not directly attempt to predict final fracture. It is often useful to look at the maximum strain as predicted by a material nonlinear analysis and ensure that this stays well below the fracture strain. As the strain increases towards the fracture strain any form of material nonlinear analysis becomes increasingly unreliable. Generally I consider “failure” to have occurred if the maximum strain exceeds around 3 to 5%.
Deliverables Q3
Prior to a couple of years ago Strand7 material nonlinear analysis could only be undertaken for models comprised of plate and or brick elements. Strand7 has recently introduced a facility that allows for material nonlinear analysis of models incorporating beam elements. Whenever a new facility is introduced it is wise to investigate whether it gives reasonable results by comparing it to either “standard” results that can be manually checked or by comparison to another computer prediction.
Included with this assignment is a single Strand7 model containing two versions of the same beam, one using beam elements and the other using plate elements. The model is complete and ready for material nonlinear analysis except for the load increments. Your job is to use a combination of your manual calculations and comparisons between the predicted results for these two beams in order to establish whether or not you consider that we can have confidence in the material nonlinear analysis capability of Strand7. Do not tell me anything about buckling or geometric second order effects. The focus of this assignment is only on material nonlinear analysis.
The following suggestions are made to assist you in addressing this task.
Start by inspecting all aspects of the model and thoroughly documenting the nature of the beams that are being modelled, what they are made of and how they are loaded and supported. Are the two beams really identical. (Note that plate edge loading has been used to apply the load to the plate element model “Attributes of a Plate / Edge load / Pressure”). Take particular notice of the Table / Stress vs Strain that has been set up to model the nonlinear stress strain relationship for the steel. Next consider the load increments. If you ask Strand7 to undertake a normal linear static analysis, then it will find a solution even if the predicted stress is say 10 000 MPa. If you ask Strand7 to undertake a material nonlinear analysis of a beam for a load that is in excess of its capacity then it will fail to converge. So unless you intend to do a lot of trial and error with load increments then you need to manually be able to come up with a reasonable prediction of the “failure load”. The beam elements of the models will fail due to increasing bending moments. Recognise that there is a first yield moment capacity My = fyZ and a full plastic section capacity Mp = fy Sx (or fy Ze).
The beams that are modelled are fixed ended with a UDL for which the end moments and mid span moment are wL2/12 and wL2/24. This information together with the yield moment should allow you to calculate the load increment corresponding to first yield at the point of highest moment. You should also be able to calculate the load increment corresponding to the full plastic section capacity at the point of highest moment. But you will discover that the load can be increased further beyond this – can you predict how far this will be manually?
a) Start with a simple linear static analysis and compare the results for the two beams. Note that you cannot (unfortunately) get a graph of the bending moment for the plate element model. But you can look at the predicted midspan deflections and the stresses at corresponding points.
(50 marks)
b) Next set up your load increments and undertake a material nonlinear analysis up to the load increment you think will represent the final capacity of the beam. Try to increase the load as far as possible before non-convergence is reached. Record your results for both beams and make comparisons between these and with your manual predictions of My and Mp. Unfortunately the beam element model cannot tell you what the strains are but Rainbow icon / Beam / Contour / Stress / Yield ratio will give you a plot of how much of the beam has been subject to yield. (It is best to look at the beam in “solid” when looking at this.) Refer to the Strand7 Help files to tell you what the Yield ratio is (it is a bit hidden in the help files but you can find it). Provided you have asked the solver to calculate “plate strain” then you can look at the strains predicted for the plate element model. It is useful to use Rainbow icon / plate / contour / strain / settings / User range to set the maximum limit of strain to that corresponding to the yield strain. Any white areas on the contour plot will then correspond to regions where yield has developed. (You may either look at the strain in the global Z direction or at the von Mises strain.) (60 marks)
c) Set up a graph showing the variation of the bending moment (at the point of maximum moment) as the load is increased with the load increment factor. (Graph icon / New / Versus results case / Beam icon / Force and moment / BM on plane 2 / Position AND be sure to check the Load case / Freedom case Factor button.) Discuss why this is not a straight line. Similarly graph the variation of the mid span bending moment. Discuss what this means in terms of the “moment redistribution” that is permitted in AS3600. (20 marks)
d) Recall the “total static moment” wL2/8. Confirm that while the moments vary “oddly” as yield develops, that the sum of the end and central moments remains equal to the total static moment.
(10 marks)
e) Set up a graph showing the variation of the central point deflection as the load is increased and again discuss its shape. (10 marks)
f) Provide a full load history for the beam up to the maximum load that it can take and describing the different things that are going on within the beam as the load is increased. (20 marks)
g) You may choose to refer to AS4100 Clause 4.5 and discuss what the advantages of material non linear analysis may be to the design engineer. Draw some overall conclusions about Strand7 material nonlinear analysis. (20 marks)
h) Issues that you remain uncertain of. (10 marks)
It is a pretty big job coming at the end of semester. I will not be expecting too much clarity of understanding from all of you – but I will be expecting evidence that you have done your best to learn from examination of the models and the results that they give.